ECG a methodical approach
Peer reviewed by Dr Hayley Willacy, FRCGP Last updated by Dr Colin Tidy, MRCGPLast updated 14 Dec 2022
Meets Patient’s editorial guidelines
Medical Professionals
Professional Reference articles are designed for health professionals to use. They are written by UK doctors and based on research evidence, UK and European Guidelines. You may find the Electrocardiogram article more useful, or one of our other health articles.
In this article:
See also the separate articles ECG Identification of Arrhythmias, ECG Identification of Conduction Disorders, Supraventricular Tachycardia in Adults, Paediatric Supraventricular Tachycardia, Ventricular Tachycardias, Narrow Complex Tachycardias and Broad Complex Tachycardias.
Most modern ECG machines have a computerised system for interpretation but the clinician (doctor or nurse) should have at least a basic understanding of interpretation, as machines are not infallible. The best results are obtained when reliable machine interpretation is used in addition to the knowledge and skill of the clinician.
Minor abnormalities of the ECG are very common and become exponentially more common with advancing years.1
Interpretation requires some clinical details. Establish:
The age of the patient.
Whether there is a history of chest pain or previous myocardial infarction.
Any complaint of palpitations.
The patient's body type: tall and thin or short and wide.
Whether the patient has chronic obstructive pulmonary disease (COPD) or hypertension.
Continue reading below
Identification
The tracing should include the name of the patient, the date and the time of recording.
Quality and calibration
There must be a full 12 leads recorded and labelled plus a rhythm strip, usually from lead II.
The baseline must be stable and not wandering. Leads must be well attached, even if this means shaving a hairy chest.
There should be little interference from skeletal muscle. The patient must be relaxed and comfortable. Sometimes dyspnoea makes this difficult.
There should be a square wave calibration to show that 1 mV is equivalent to 1 cm in height.
Speed should be 25 mm/sec. Hence, 1 large square is 200 msec and 1 small square is 40 msec.
Continue reading below
Rhythm and rate
Start with the rhythm strip. This is a more prolonged recording of lead II.
Are there P waves?
Are they regular?
Does every one precede a QRS?
Is the PR interval constant?
What is the PR interval?
The PR interval should be between 120 and 200 msec (3 to 5 small squares).
What is the ventricular rate?
There are several methods of doing this.
Count the number of R waves over 15 large squares (3 seconds) and multiply by 20. To be slightly more accurate, count the number of R waves over 30 large squares (6 seconds) and multiply by 10. The latter is preferable if the rate is slow or irregular.
QRS complex
Turn next to the precordial leads.
In V1, R should be much smaller than S.
In V6, Q should be much smaller than R.
R and S should be of approximately equal size around V3 or V4.
How long is the QRS complex?
It should be between 80 and 120 msec or 2 to 3 small squares.
Look at the V leads and measure the height of the tallest R and the deepest S. The sum should not exceed 40 mm (some say 35 mm). If the sum of the deflections exceeds 40 mm there is electrical left ventricular hypertrophy (LVH). Assessment of left ventricular mass by ECG criteria is unreliable.2 However, electrical LVH carries a poor prognosis.3
Where there are Q waves, the depth should be no more than the height of the R in that lead.
The ST segments should not be more than 1 mm above or below the baseline. A little more deviation may be allowed in V1 and V2.
In V1, T may be upright, inverted biphasic or flat.
In V3 to V6, the T wave must be upright.
Now turn to the limb leads:
If there is a Q wave in I, II, aVL or aVF it should not be more than a quarter of the size of the R wave.
Larger Q waves may be found in III and aVR.
Abnormal Q waves suggest myocardial infarction, old or recent.
The ST segments should not be more than 1 mm above or below the baseline.
aVR often has inverted P and T waves and a predominantly negative QRS complex. It should be thought of as an upside down lead.
Electrical axis
A tall, thin person will have a fairly vertical heart showing a right axis shift.
A short, broad person will have a fairly horizontal heart showing a left axis shift.
Electrical axis can be made unnecessarily complex but the following is a very simple guide:
Look at lead I. Measure the height of the positive deflection and subtract from it the depth of the negative deflection.
Look at aVF and do the same.
If the mean vectors in both I and aVF are both positive, the axis is between 0 and 90° and this is normal.
If I is positive but II and aVF are negative, this is left axis deviation (LAD). LAD up to −30° can be normal.
If I is negative and aVF is positive, this is right axis deviation (RAD).
If both I and aVF are negative, this is extreme axis deviation, sometimes called 'north-west territory'.
Common ECG abnormalities
The following are just a few of the most common abnormalities to be encountered. The list is far from exhaustive.
Atrial flutter
P waves are well demonstrated in II, III and aVF but are best examined in V1.
Atrial flutter shows clear P waves like the teeth of a saw. There is usually a rapid ventricular rate and a 2:1 atrioventricular (AV) block. The atrial rate is usually around 300 a minute with a ventricular rate around 150.
Atrial fibrillation
In atrial fibrillation (AF) the pattern is far less obvious. There may be rapid, small undulations, no apparent pattern or a pattern like a worn-out saw, compared to the new saw pattern of flutter. This means that the amplitude is much lower than in flutter.
Abnormal PR interval
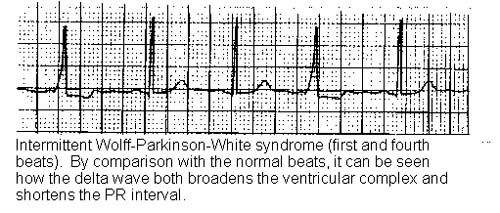
The PR interval is short in Wolff-Parkinson-White (WPW) syndrome. It is also short in the Lown-Ganong-Levine (LGL) syndrome that is also a pre-excitation syndrome. It is less common, more controversial and is also described in its own article. There is a small deflection of the upstroke of the R wave in WPW syndrome. This is called a delta wave and is due to conduction through the aberrant bundle of Kent. It is absent in LGL syndrome.
In first-degree heart block there is a prolonged but constant PR interval. It is over 200 msec and all P waves are followed by a QRS.
Second-degree heart block is called Mobitz I or Mobitz II:
In Mobitz I (Wenckebach's phenomenon) the PR interval becomes progressively longer after each beat until a QRS is dropped and the pattern starts again.
In Mobitz II the PR interval is prolonged but, at regular intervals such as every third or fourth P wave, there is not a QRS to follow.
Third-degree heart block is complete AV dissociation and there is no relationship between the P waves and the QRS complexes. They are fired from different pacemakers. Bradycardia is usual.
WOLFF-PARKINSON-WHITE SYNDROME
Continue reading below
Ventricular tachycardias
In supraventricular tachycardia (SVT) the rate is very fast, without a preceding P wave. There may be retrograde conduction to excite the atria in reverse order. SVT may look rather similar to a fast AF but the rhythm is likely to be more regular. With a fast rate there may be little time between QRS complexes so that atrial forms are difficult to find. The shape of the QRS complex is basically normal, as the pacemaker is at or near the AV node and conduction spreads down the Purkinje fibres in the usual way.
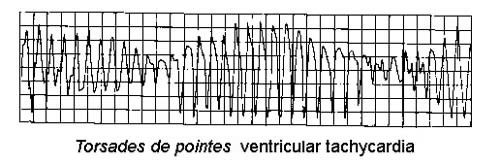
In ventricular tachycardia the rate is also very fast but the complex is abnormal, as the pacemaker is not high up in the conducting system. A broader complex and inverted T waves are usual.
Torsades de pointes
Myocardial infarction
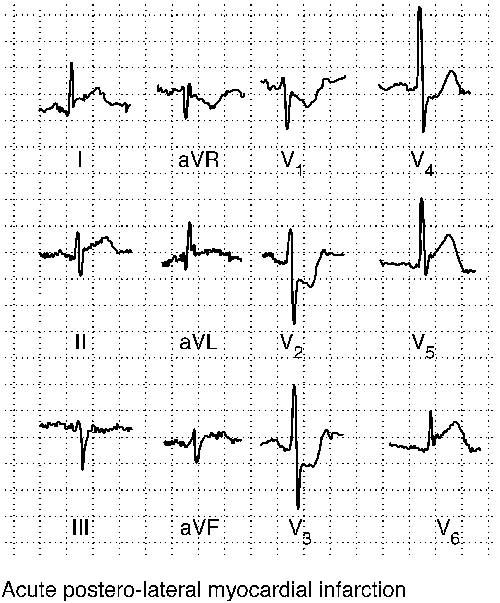
The picture with myocardial infarction will vary according to the site of the infarction and whether it is partial-thickness or full-thickness. Leads I and aVR are anterior leads. II, III, and aVF are inferior leads. The V leads will show if it is anterior-septal with early V leads affected or anterior-lateral with late V leads involved.
In the acute phase there is ST elevation over the affected area. This often occurs within minutes but may take up to one hour (and so the initial ECG may be normal).
With a full-thickness infarct there may be ST depression over the reciprocal leads (inferior leads in an anterior infarct and anterior leads in an inferior infarct).
T waves are higher and wider. This is called hyperacute T-wave changes.
Pathological (abnormal) Q waves are defined as greater than one third the height of the R wave, greater than 0.04 sec (40 msec) in duration, or present in the right precordial leads.
Over the next few hours the ST segments return to normal and, shortly afterwards, the T waves become inverted but Q waves remain.
If occlusion of the coronary artery is incomplete, infarction can occur without Q waves.
If there is ST depression in V1 and 2 but no other signs, add V7, 8, 9 as it could be a true posterior infarct. True posterior myocardial infarct is discussed in its own article.
V7 is along the same line as V5 and V6 but in the posterior axillary line and V8 and V9 are the same distance along again.
The use of ECGs to diagnose myocardial infarction and to start thrombolysis is validated.4 The diagnostic ECG criteria for thrombolysis have varied slightly over the period of a few years but for both anterior and inferior infarction the criteria are:
1 mm of ST change in at least two contiguous limb leads (II, III, aVF, I,aVL).
2 mm of ST change in at least two contiguous chest leads (V1-V6).
New left bundle branch block.
Diagnosis of an acute myocardial infarction can be very difficult in the presence of an old myocardial infarction or left bundle branch block (LBBB).
The diagnostic criteria for a true posterior infarct are not so well agreed, as discussed in the article. This makes the early initiation of thrombolysis more difficult.
MYOCARDIAL INFARCTION
Acute coronary syndrome5
The term acute coronary syndrome encompasses a range of coronary artery diseases, including unstable angina and both ST-segment-elevation myocardial infarction and non-ST-segment-elevation myocardial infarction. Diagnosis requires an ECG and a careful clinical review. In acute coronary syndrome, common ECG abnormalities include T-wave tenting or inversion, ST-segment elevation or depression including J-point elevation in multiple leads and pathological Q waves.
Bundle branch block6 7
Right bundle branch block (RBBB) may occur as a congenital anomaly or in association with volume overload in the right ventricle. LBBB is almost always pathological, reflecting disease of the left ventricle. There are left and right bundles but the left has an anterior and posterior fascicle.
RBBB produces a prolonged QRS, usually about 160 msec or four small squares and an RSR pattern seen best in V1. There may well be T-wave changes in the septal leads.
Left anterior hemiblock is associated with LAD (with an initial R in II, III and aVF, Q in I and S in III).
Left posterior hemiblock is rarer. There is RAD, S in I and Q in III.
Complete LBBB produces a longer QRS, usually around 200 msec with a more square pattern than RBBB. The changes are best seen in the lateral V leads. There may also be some ST elevation or depression.
Axis deviation
Causes of LAD
Left anterior hemiblock.
Inferior myocardial infarction.
Ostium primum atrial septal defect.
Some authorities say that LVH causes LAD whilst others are adamant that it does not.
Causes of RAD
Normal finding in children and tall thin adults.
Right ventricular hypertrophy.
Chronic lung disease even without pulmonary hypertension.
Anterolateral MI.
Left posterior hemiblock.
WPW syndrome.
Ostium secundum atrial septal defect.
Causes of extreme axis deviation
Emphysema.
Hyperkalaemia.
Pacemaker.
Causes of ST-segment changes
Digoxin produces a down-sloping ST depression.
Pericarditis causes ST elevation that tends to be generalised and not located to the area supplied by one coronary artery.
Ventricular aneurysm causes ST elevation. This usually follows a large anterior infarct and, if the ST segment fails to return to the baseline, an echocardiogram is required to exclude aneurysm.
ST depression suggests ischaemia and/or unstable angina. Extensive ST depressions with a clinical picture of myocardial infarction can indicate subendocardial damage.
Right ventricular hypertrophy
The R wave is bigger than the S in V1.
T waves
Inverted T waves in a predominantly positive lead suggest ischaemia or old myocardial infarction. T waves should be upright in V3 to V6.
Tall T waves occur in the acute phase of myocardial infarction and in hyperkalaemia.
Misplaced leads
Wrongly attached leads, such as left and right arm reversed, will produce abnormalities in the tracing.
If the two ankle leads are reversed, it will make little difference.
If the F lead is reversed with one of the arm leads, the ECG will seem very strange except in the V leads. There may be extreme axis deviation.
If the left and right arm leads are reversed, lead I will show inverted P and T with a predominantly negative QRS whilst V leads are normal. Dextrocardia will show a similar pattern in lead I but leads V1 to V6 will show remarkably little change across their course. Misplacement of the arm leads is much more common than dextrocardia.
Pulmonary embolism8
Traditional teaching is that S in 1 and Q and inverted T in III are features of pulmonary embolism. It is taught as S1, Q3, T3.
Learning to read ECGs
A written text like this is of limited value in helping to acquire the expertise to read ECGs. Practice looking at tracings is essential. For that reason, several websites have been given where samples of ECGs can be seen and interpreted. See the Further Reading section below for some examples.
Further reading and references
- Consensus guideline for recording a standard 12-lead electrocardiogram; Society for Cardiological Science & Technology, September 2017.
- The ECG Made Easy (8th ed) 2013
- ECG Image Index; ECG Learning Center
- ECG Library
- ECG Quiz
- How to Read an ECG; Geeky Medics.
- De Bacquer D, De Backer G, Kornitzer M; Prevalences of ECG findings in large population based samples of men and women. Heart. 2000 Dec;84(6):625-33.
- Beyerbacht HP, Bax JJ, Lamb HJ, et al; Evaluation of ECG criteria for left ventricular hypertrophy before and after aortic valve replacement using magnetic resonance imaging. J Cardiovasc Magn Reson. 2003 Jul;5(3):465-74.
- Larsen CT, Dahlin J, Blackburn H, et al; Prevalence and prognosis of electrocardiographic left ventricular hypertrophy, ST segment depression and negative T-wave; the Copenhagen City Heart Study. Eur Heart J. 2002 Feb;23(4):315-24.
- Massel D; Observer variability in ECG interpretation for thrombolysis eligibility: experience and context matter. J Thromb Thrombolysis. 2003 Jun;15(3):131-40.
- Birnbaum Y, Wilson JM, Fiol M, et al; ECG diagnosis and classification of acute coronary syndromes. Ann Noninvasive Electrocardiol. 2014 Jan;19(1):4-14. doi: 10.1111/anec.12130. Epub 2013 Dec 30.
- Ikeda T; Right Bundle Branch Block: Current Considerations. Curr Cardiol Rev. 2021;17(1):24-30. doi: 10.2174/1573403X16666200708111553.
- Perez-Riera AR, Barbosa-Barros R, de Rezende Barbosa MPC, et al; Left bundle branch block: Epidemiology, etiology, anatomic features, electrovectorcardiography, and classification proposal. Ann Noninvasive Electrocardiol. 2019 Mar;24(2):e12572. doi: 10.1111/anec.12572. Epub 2018 Jun 22.
- Su XF, Fan N, Yang XM, et al; A Novel Electrocardiography Model for the Diagnosis of Acute Pulmonary Embolism. Front Cardiovasc Med. 2022 Apr 11;9:825561. doi: 10.3389/fcvm.2022.825561. eCollection 2022.
Article History
The information on this page is written and peer reviewed by qualified clinicians.
Next review due: 13 Dec 2027
14 Dec 2022 | Latest version

Feeling unwell?
Assess your symptoms online for free