Translating Defocus Curves from D to feet.
Posted , 9 users are following.
In trying to use defocus curves, the horizontal (D) axis can be confusing. I propose to translate that axis to feet.
Defocus curves are normalized to label the maximum acuity as zero D.
When you have an IOL placed, there is an amount of lens diopters that would make the best focus be at far distances (such as infinity). People often "target" a max sharpness on an IOL to be nearsighted by some amount. This might be expressed as -0.75 D target. When I use the term target, that is accurate for planning. Once implanted, there is a focus reality, but for convenience, I will use the word target to also mean that. Maybe there is a better word to use for both, but for what you can control, you can control your target. You cannot control your reality.
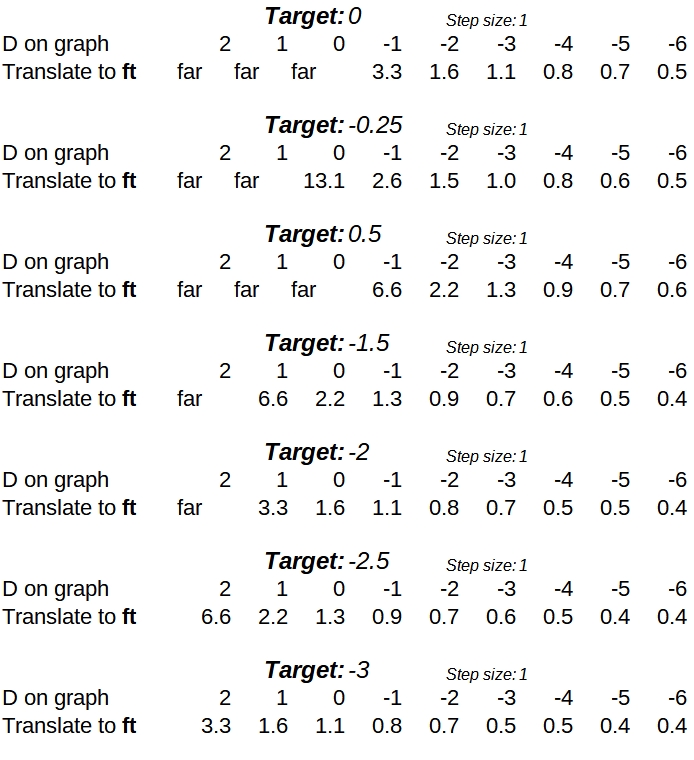
So the D-scale conversion is very much a function of the target. I have made a spreadsheet, and will post some examples for various targets.
Initially, I will choose -targets from 0 D to 3 D as targets, and provide conversions from D to ft. Example, if your target is -1.5 D, then the 0 on the horizontal axis corresponds to 2.2 ft. The -1 on the axis corresponds to 1.3 ft.
0 likes, 24 replies
lucy24197 trilemma
Edited
The equation (1/D)/0.0254 gives you the results in inches.
trilemma
Posted
I see I missed including target:1.0 in the table. I have already revised my spreadsheet, and will post an updated image. Let's see if I want to incorporate other changes. For example, in addition to each "Translate to ft" line, I could add another line "Translate to cm" or "Translate to meters".
Any questions on what this table is about or how you would use it?
jimluck trilemma
Edited
Here's how I do it (see my graph by clicking on image)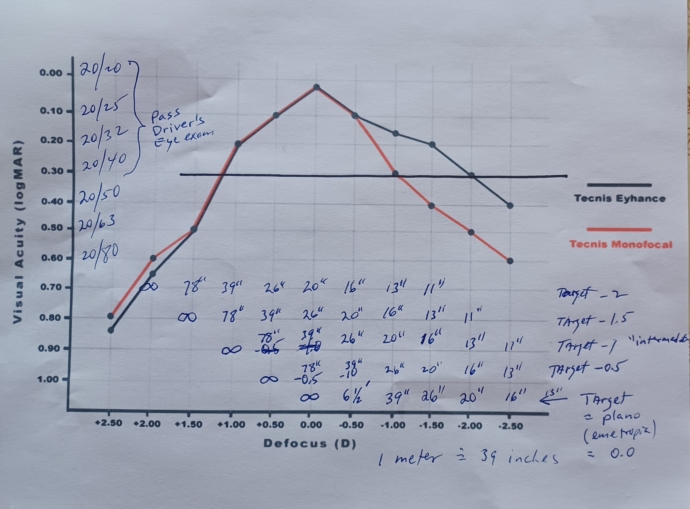
sam36130 jimluck
Posted
Hi,
i dont quite understand how to read the curve. for example, at plano, visual acuity is 20/20 at 0D, but at -1 target, does the 20/20 visual acuity land at 39" and anything over 39" will have visual acuity about 20/25 to 20/40?
trilemma sam36130
Posted
No. The real curve is smooth. So at 42 inches, the acuity might land at 20/21
Guest sam36130
Edited
This is two defocuse curves. It compares a standard Tecnic monofocal with the Eyhance monofocal. The visual acuity is on the Y axis. Defocus is on the X axis. For the regular monofocal the -1D (39") defocus acuity is 20/40. For the Eyhance it appears to be around 20/28 ish. If you want to use a defocus curve to predict acuity with different targets I would suggest that its easier to just shift the whole curve to the right.
aspen88 jimluck
Posted
hi Jim. not sure if you're still in this forum but does this mean at plano, you can have good visibility from far up to 20 inches but only up to 39 inches for regular Technis? so Eyhance gives you 19 more inches of visibility? thank you!
trilemma aspen88
Posted
I would suggest you not take that at face value. If you just go by that curve, it would seem that the Technis would perform as well as a regular monofocal at peak focus.
So you are reading the graphs correctly. I am saying to be skeptical of the graph.
aspen88 trilemma
Posted
thank you. i'm trying to find out how much more intermediate distance is eyhance really expected to provide, assuming average results.
Guest aspen88
Edited
It varies so much from person to person so take it all with a grain of salt. But I think it's safe to say that most people can rely on getting decent vision down to 26" or so (outstretched arm / fingertips) with Eyhance. Don't expect near. Do expect good dashboard vision in good light.
RonAKA jimluck
Edited
I would suggest that those defocus curves are suspect for the Eyhance lens. They show no loss of peak visual acuity due to the extended depth of focus features of the lens, and also show an unrealistically large gain in near vision at logMAR 0.2 and 0.3, with gains up to 1.0 D. Lenses that qualify as an EDOF require a minimum gain of 0.5 D, and Eyhance lens is not even marketed as an EDOF. The Eyhance has more like 0.25 D of a gain. These defocus curves comparing the Eyhance to the Tecnis 1 are much more realistic.
.
RonAKA aspen88
Edited
See this graph comparing the Tecnis 1 to the Eyhance. Also keep in mind that the Tecnis 1 has the least amount of depth of focus of all monofocals. Recent Alcon data showed that the difference between a Clareon and Eyhance was clinically insignificant.
Guest RonAKA
Posted
Note that the Eyhance defocus curve you are saying is "suspect" is a binocular defocus curve while the more "realistic" one is monocular,
RonAKA Guest
Posted
I am not sure which curve you are talking about. What I find suspicious about the one @jimluck posted is that the Tecnis 1 and Eyhance have identical peak visual acuity points. It is showing no visual acuity loss with the enhanced depth of focus.
trilemma
Edited
Very nice useful presentation, Jimluck. I commend you.